Submitted by Dr C.M. Martin-Jones on Mon, 11/08/2025 - 10:20
After decades of research, seismologists understand why earthquakes occur, but they still can't predict when they will happen. Rather than pinpointing their exact timing, scientists can only estimate the likelihood of future quakes within broad time windows.
Earthquakes happen when pent-up stress on a fault is released suddenly, a phenomenon governed by complex and unpredictable processes in the crust. Earthquake behaviour is also difficult to anticipate because scientists only have limited observations of major earthquakes, as they tend to recur only once every few decades to centuries.
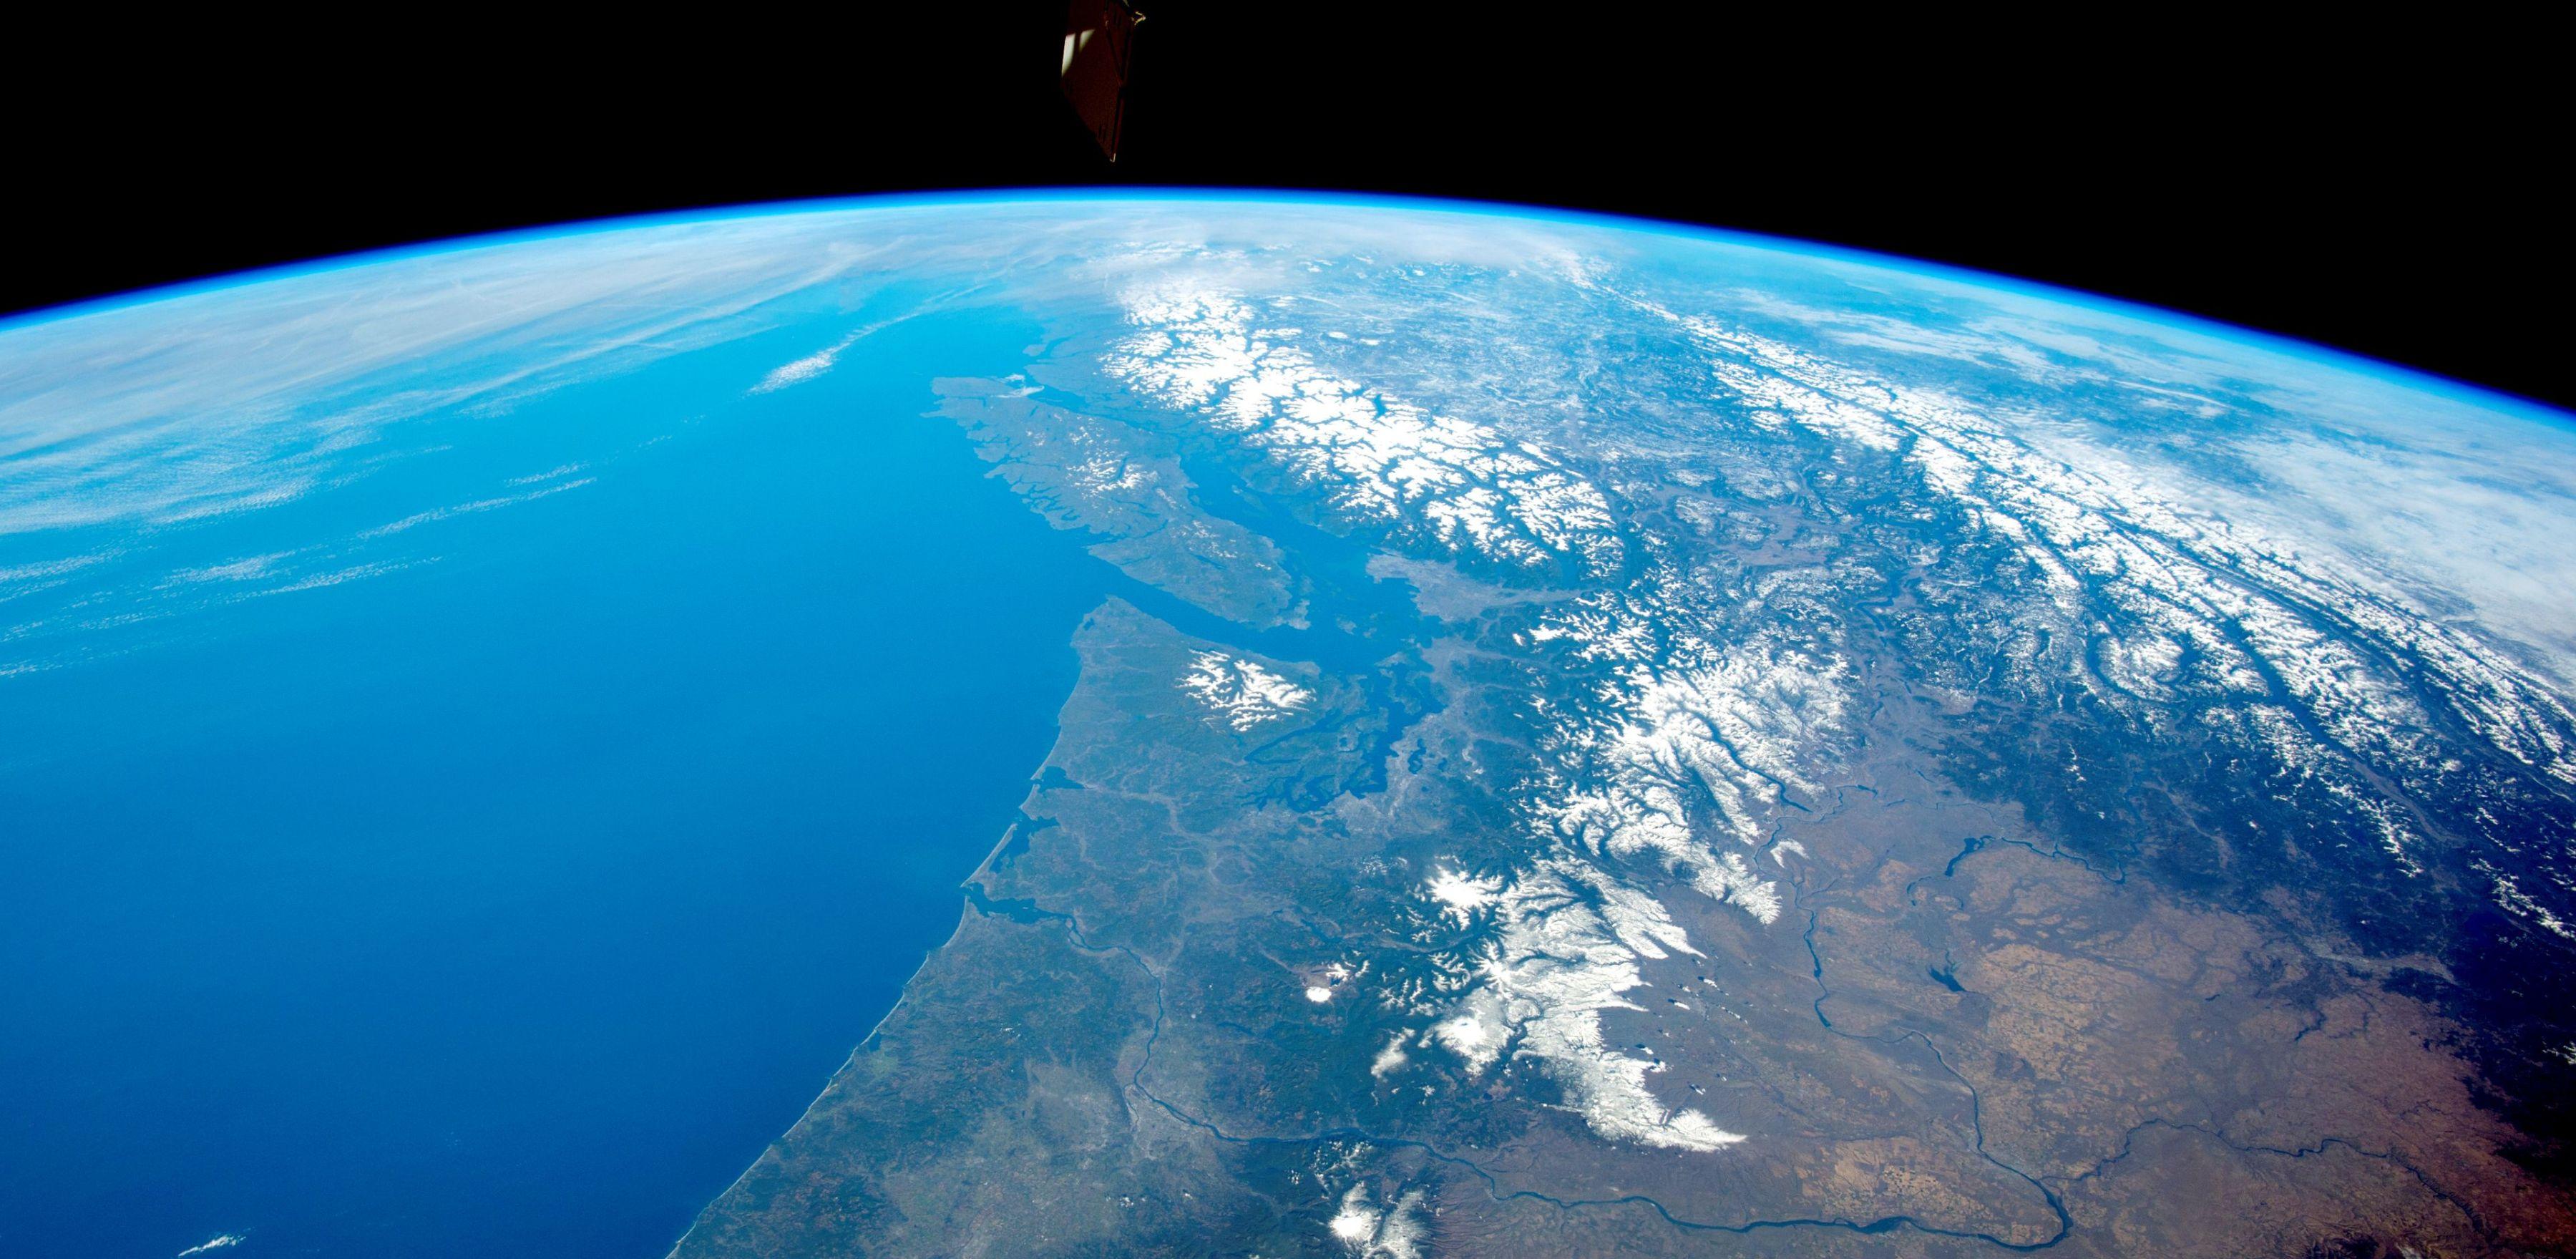
To learn more about earthquake behaviour, Adriano Gualandi, Assistant Professor of Geophysics at the Department of Earth Sciences, has developed a map charting decades of so-called ‘slow earthquakes’ across the Cascadia region of the Pacific Northwest.
Unlike regular quakes, slow earthquakes unfold over days to weeks—rather than seconds—and generate tremors so subtle they’re barely perceptible. Since they recur more frequently than typical earthquakes, this type of tectonic activity is particularly useful for learning about patterns of fault rupture through time. “Slow earthquakes are complex, but they do exhibit some level of predictability,” said Gualandi.
Until recently, scientists tracked slow earthquakes by detecting tiny tremors using seismic stations (devices that measure ground shaking). Gualandi’s new map is the first to use geodetic data—which tracks how the Earth's surface deforms or shifts over time, not just the shaking—to provide daily updates of slow earthquakes.
His new method can detect ground movement that seismic stations miss, and the daily updates allow scientists to spot new slow earthquakes in real time as they happen.
Although slow earthquakes don’t pose a hazard in themselves, they can influence seismic hazards by offloading stress onto neighbouring faults—potentially triggering destructive quakes or, conversely, delaying them by diverting stress away from loaded faults.
They were first detected more than two decades ago in the Cascadia and Nankai (Japan) subduction zones, thanks to the advent of Global Navigation Satellite System (GNSS) technology that could detect minute ground movements caused by slow earthquakes.
Gualandi used data from hundreds of GNSS stations along the Cascadia fault zone to build his near real-time map of ground displacement. “Cascadia is an ideal area to study slow quakes,” Gualandi said. “We have decades of data and plenty of slow earthquake observations, so we can learn from what we’ve seen before.”
Slow earthquakes occur as frequently as once a year in some segments of the Cascadia fault. Although they cause only millimetres of surface displacement, they’re relatively easy to detect here, Gualandi said, because large earthquakes, which would otherwise mask the signal, are relatively rare.
The last major earthquake on the Cascadia fault zone struck in 1700. The magnitude 9.0+ event dropped the coastline by several feet and triggered a tsunami. Since then, stress has been building on the fault. “We know similar events could happen in the future, so we would like to understand every facet of seismic hazard, including slow quakes,” said Gualandi.
Gualandi used positional information from each GNSS station to track Earth’s surface motion in three dimensions, recording changes in latitude, longitude, and altitude over time. The data captured can be noisy, he said, with larger quakes, magma migration beneath volcanoes, seasonal rainfall shifts also contributing to the signal.
“Imagine being at a cocktail party,” Gualandi explained. “Just as your ears instinctively filter conversation from ambient music, we can tease apart different sources of ground motion amongst the GNSS data.”
To remove these other components and isolate the signal from slow quakes, he used pattern recognition techniques (a branch of machine learning) and statistical analysis. “Slow earthquakes produce a distinct saw-tooth signal, which makes them particularly recognizable,” he said.
After filtering out background noise, Gualandi used geophysical tools to convert the surface displacement into fault slip at depth. He then plotted this information on a map, which replays data as far back as 2007, showing slow earthquakes flickering across the fault.
Because his map captures slow quakes early—just as they’re unfolding—Gualandi said it could be used to provide an indication of possible changes in the stress field. This approach marks a departure from previous studies, which typically examine slow earthquakes retrospectively. “We’re now in a position where we can study slow earthquakes prospectively and see if we are able to forecast them in real time, as is routinely done for other complex systems like the weather,” said Gualandi.
Read the article:
Gualandi, A., 2025. Near real-time Cascadia slow slip events. Geophysical Journal International, 242(2), https://doi.org/10.1093/gji/ggaf198
Feature image:
Panorama of the Pacific Northwest, credit NASA Earth Observatory.
