

The Cambridge Volcano Seismology Group are livestreaming earthquake data from Iceland’s Reykjanes Peninsula for the public to watch online in real-time.
Earlier in November, a vast sheet of magma pierced through rocks beneath the Peninsula — triggering seismic shaking and forcing evacuations from the coastal town of Grindavík. Scientists are now monitoring the seismic data and ground deformation carefully to determine the potential of an eruption.
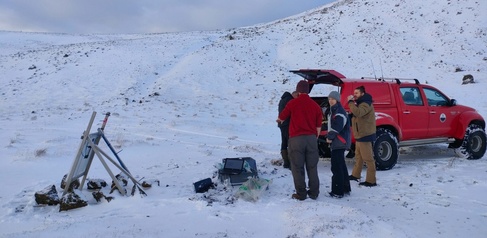
The live data comes from a seismic station close to Hagafell — located almost directly above the recent magma intrusion. This station is one of a network installed across the Peninsula in 2020 as part of an ongoing collaboration between Cambridge and Iceland Universities.
Postdoc Tim Greenfield and PhD student Tom O’Hara, both from our Department, headed out to Iceland last week on a routine trip to service and update the stations.“It turned out that this recent seismic swarm happened right in the middle of our seismic station network. In fact two of our seismic stations are located almost on top of the dyke, so that means we have an enormous amount of data at our fingertips,” said Greenfield.
Normally their seismic stations are offline, meaning that they have to manually download the data once or twice a year. But, in a collaboration with University of Iceland, the Icelandic Met Office and ÍSOR (Iceland GeoSurvey), the team have now configured these stations so that they can monitor the data remotely.
“The upshot is that we can also do some interesting things with the data, like livestream it for the public to see,” said Greenfield. “It’s really easy to pick out the earthquakes on the screen and a great way to engage people with the science.”
Greenfield said that the influx of high-quality seismic data will also help scientists understand, over the longer term, the processes responsible for these pulses of activity and how they are geologically linked.
“This episode is more suggestive of the long term activity we might see in Reykjanes, which activates roughly on the order of every 800 years or so,” said Greenfield, “it seems likely that we might be entering a phase of heightened activity in the area.”
Feature image: a still from the livestream. The green line shows vertical or P waves; the red and blue lines show horizontal shaking. Even small earthquakes show up clearly (look for the sudden P wave arrival) because of the location of the seismic station on top of the intrusion.